Read public issues with the right evidence, denominator and date
A useful explanation of a public issue tells you what happened, what the evidence can establish and what remains a judgment. It should also help you take the next step: interpret a statistic, understand a historical decision or assess a practical option. This collection approaches politics, social questions and everyday life through those distinctions.
Start with the question you actually need answered. “Did the number increase?”, “Did the risk increase?” and “Did this policy cause the increase?” may concern the same headline, but they require different evidence. The examples below show how to keep those questions separate without turning ordinary reading into a research project.
Choose a route through the collection
| Question | Starting point | What to look for |
|---|---|---|
| How should I read a social statistic? | Teen birth rates and earnings comparisons | Population, period, units and denominator |
| How does an institution affect everyday access? | Social-work support and accessible telehealth | The steps between an offered service and usable help |
| How can I compare practical choices? | Transport and environmental impact and household sustainability | A consistent comparison and an achievable next action |
| What did a historical decision change? | Coca leaf and international policy and the ACA transition | The date, scope and distinction between then and now |
First identify what kind of claim is being made
A description reports an observation: a count rose, a document was issued or a service opened. An explanation proposes why something happened. A forecast concerns what may happen next. A recommendation adds a judgment about what ought to be done. A single paragraph may contain all four.
Consider the invented statement: “Applications increased, the new campaign caused the increase, demand will keep rising, so the office should hire more staff.” The application count might be directly documented. The causal explanation needs more than timing. The forecast needs assumptions. The staffing recommendation depends on workload, service standards, costs and alternatives.
Separating those parts does not make action impossible. It helps a reader accept a well-supported observation without accidentally accepting every inference attached to it. It also makes disagreement more precise: people may agree about demand while disagreeing about the best response.
More completed cases can coexist with a smaller completion share
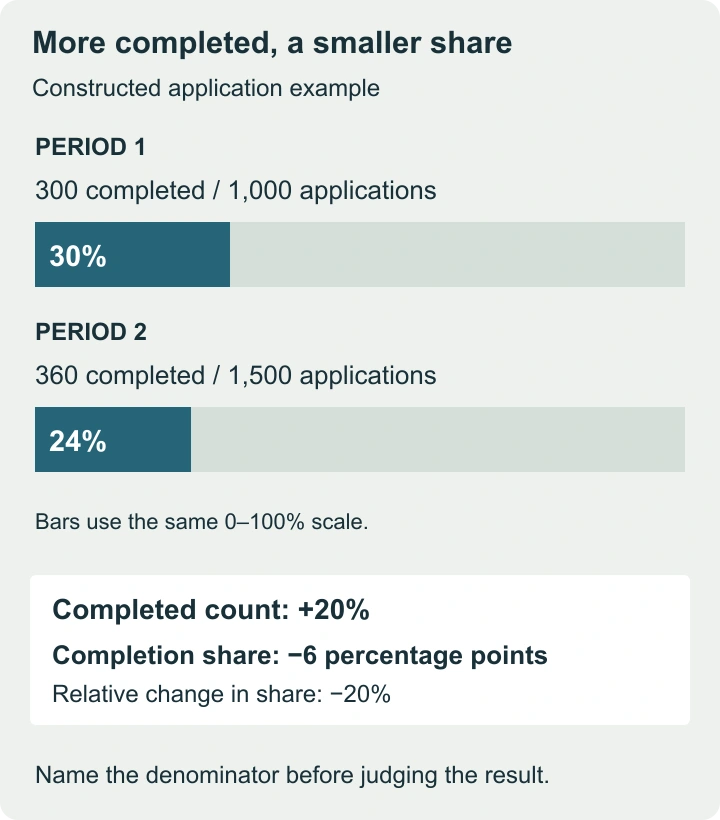
Imagine an office that completes 300 of 1,000 applications in one period and 360 of 1,500 in the next. These are fictional figures with comparable periods and an unchanged definition of completion. The completed count increased by 60, or 20%. The completion share fell from 30% to 24%.
| Measure | Calculation | Result |
|---|---|---|
| Change in completed count | 360 − 300 | 60 more completed applications |
| Relative change in completed count | 60 ÷ 300 × 100 | 20% increase |
| Change in completion share | 24% − 30% | 6 percentage points lower |
| Relative change in completion share | (24 − 30) ÷ 30 × 100 | 20% decrease |
None of these statements contradicts the others. They answer different questions. Staff may be completing more work while demand grows faster. A headline using only the completed count could obscure a service-access problem; a headline using only the share could obscure the additional work performed.
The denominator should match the question. If only complete applications enter a published rate, people who abandon an inaccessible form may be absent. That is not automatically an error in the published measure. It becomes a problem when the measure is described as covering everyone who tried to use the service.
Check the scope before comparing two numbers
Write down five details:
- who or what is counted,
- where,
- during which period,
- in which unit
- and under which definition.
A weekly measure cannot be compared directly with a monthly total. A household is not a person. A median is not an arithmetic mean. A survey of respondents is not necessarily a complete count of all eligible people.
For an ordinary news story, this check can be brief. Suppose a chart labels one line “applications received” and another “people served.” Ask whether a person can make more than one application and whether receiving service happens in the same period. Without that information, subtracting one line from the other may not produce a meaningful backlog.
If a definition changes, a break in the series may explain part of an apparent jump. Look for the publisher’s methodological note before inventing a behavioral explanation. Preserve the exact version or release date when a revised estimate matters to your argument.
Uncertainty is more than a plus-or-minus number
The UK Office for National Statistics distinguishes sampling error from other sources of error, such as nonresponse, inaccurate answers and processing problems. A confidence interval helps express sampling uncertainty under the method used. It does not automatically account for every weakness in measurement or every group missed by the data collection.
In practice, ask what uncertainty could change the conclusion. A small estimated difference may not support a confident ranking. A large, clear difference might remain important even though its exact size is uncertain. Statistical significance also does not tell you whether a difference is large enough to matter for the decision at hand.
A useful report states the limitation alongside the finding: “The estimate rose, but the available uncertainty measure does not establish a clear change.” That is more informative than either ignoring uncertainty or dismissing the entire dataset because it is imperfect.
Sequence is evidence about timing, not a complete causal test
If a service improves after a policy changes, the chronology is relevant. It does not establish how much of the improvement the policy caused. Staffing, demand, the economy, reporting practices or other interventions may also have changed.
Ask what comparison would make the explanation stronger. Did similar places without the policy change in the same way? Were the groups already on different paths? Was the outcome defined before results were examined? A comparison can be informative without being conclusive, provided its limits are stated.
For a practical reader, the goal is not to invent an evaluation from a headline. It is to notice when descriptive evidence is being asked to carry a causal conclusion. The separate volunteering guide, for example, distinguishes finding useful work from treating associations with volunteering as guaranteed personal benefits.
Keep historical accounts separate from current instructions
An old publication date can be part of a useful historical record. It is not a reason to reuse an expired application deadline, medical recommendation or service contact. Equally, a later explanation should not imply that people at the time already knew the later outcome.
Read the stated time frame before applying a conclusion. The February 2022 regional retrospective uses a historical cutoff. Its value is in explaining that period, not in presenting a current news briefing. A dated institutional assessment should remain identified as an assessment rather than silently becoming an established final result.
End with a proportionate next step
After reading, try a three-sentence note: what is established, what remains uncertain and what action the evidence supports. For the application example, the office completed more cases; the share completed fell; further work should examine demand, eligibility and access before choosing a staffing response.
For a household, the next step may be a small measurement or a conversation with a qualified service. For a historical debate, it may be a more accurate understanding without any immediate action. Good evidence improves the question you ask next; it does not require every article to end with a confident prediction or a purchase.