Why US teen birth rates fell: what the figures establish and what they cannot explain
US teenage birth rates declined substantially between 2000 and 2022. Explaining that change requires distinguishing what was counted from why it changed. Birth certificates count live births; they do not count every pregnancy, and a national trend cannot establish that a particular generation, technology or local program caused the decline.
The historical address of this article dates from 2017. This is a new analysis of a later published historical series, not a claim that the 2022 results were known in 2017. It uses the National Center for Health Statistics report released on 24 July 2024 and keeps the comparison labeled 2000–2022.
Start with the outcome, age range and denominator
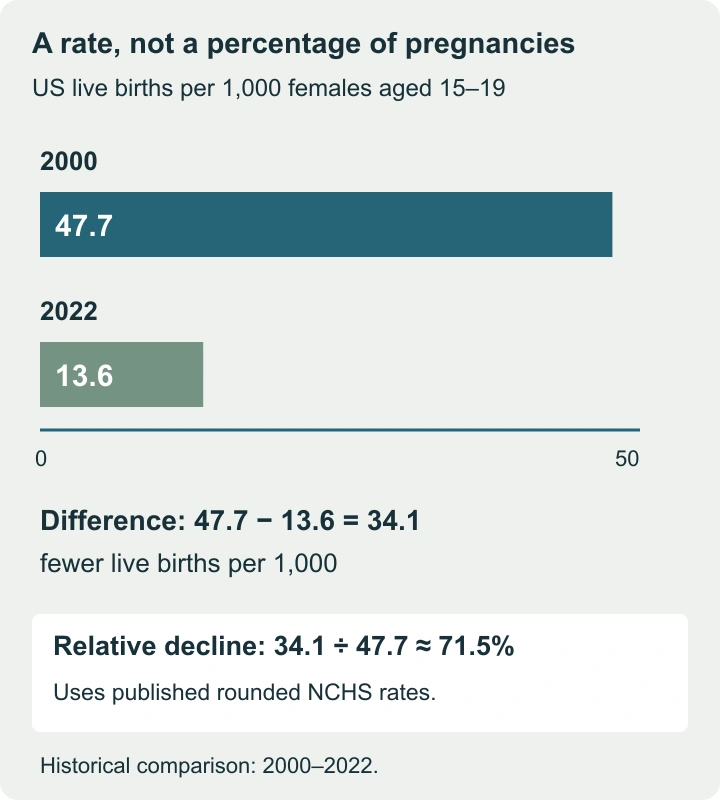
NCHS reports 47.7 live births per 1,000 females aged 15–19 in 2000 and 13.6 in 2022. The difference is 34.1 births per 1,000. Dividing that difference by the starting rate gives an approximately 71.5% decline using the published rounded values.
| Age group | 2000: births per 1,000 | 2022: births per 1,000 |
|---|---|---|
| 15–19 | 47.7 | 13.6 |
| 15–17 | 26.9 | 5.6 |
| 18–19 | 78.1 | 25.8 |
The younger and older subgroups have different levels, making their separation useful. These are historical observations, not the latest available annual figures. “Per 1,000” is a rate unit: 13.6 per 1,000 corresponds numerically to 1.36 per 100, not 13.6%.
A birth rate is not a pregnancy rate
Not every pregnancy ends in a live birth. A pregnancy measure may include abortions and fetal losses as well as live births, using the definitions and estimation methods of its source. A live-birth series alone cannot determine how all pregnancy outcomes changed.
It also matters what the numerator counts. Live births are not necessarily the number of distinct teenagers who gave birth: multiple births and the timing of events can make person counts and birth counts differ. Use the source’s own unit instead of changing “births” to “young mothers” because it sounds more conversational.
| Claim | Evidence needed | What a live-birth table cannot supply alone |
|---|---|---|
| The birth rate fell | Comparable live-birth counts and population denominators | The contribution of each cause |
| The pregnancy rate fell | A defined pregnancy series covering the relevant outcomes | Unrecorded or differently estimated outcomes |
| A program reduced unintended pregnancies | Defined intention measure, outcomes and a credible evaluation | Whether every observed pregnancy was unintended |
Why fewer births can coexist with a higher rate
Consider two fictional areas. Area A records 100 births in a population of 10,000 females in the specified age range. Area B records 80 births in a population of 4,000. A’s rate is 100 ÷ 10,000 × 1,000 = 10 per 1,000; B’s is 20 per 1,000.
Area A has more births but a lower rate. Counts help plan the amount of service that may be needed; rates help compare occurrence relative to population size. Neither should replace the other when a decision requires both. The birth-rate and change calculator keeps these units visible and calculates the two areas separately.
For the national example, do not describe the 34.1-per-1,000 difference as a number of births “prevented.” That would require population data and a clearly specified comparison scenario. Multiplying a rate difference by a convenient population creates a hypothetical estimate, not an observed causal count.
A combined rate also depends on who is in the group
Suppose an invented younger subgroup has a rate of 5 per 1,000 and an older subgroup a rate of 25. With 5,000 people in each, expected counts under this constructed example are 25 and 125, totaling 150 among 10,000: 15 per 1,000.
Now keep the subgroup rates unchanged but use populations of 7,500 younger and 2,500 older people. The weighted rate becomes 0.75 × 5 + 0.25 × 25 = 10 per 1,000. The combined rate fell although neither subgroup’s rate changed. Fractional expected counts in such a calculation are model quantities, not claims about fractional observed births.
This example does not explain the actual US decline: the published age-specific rates also fell. It shows why comparisons should check both subgroup rates and population composition. The same reasoning applies when comparing places with different age mixes.
What the evidence says about possible explanations
The NCHS report’s introduction points to research on later first sex, less sexual activity among sexually experienced teenagers and more effective contraceptive use as contributing explanations. Its comparison of birth records does not estimate a separate causal contribution for every factor.
To explain a trend, connect a proposed mechanism to the right data.
- A claim about changing behavior needs behavioral evidence.
- A claim about access to services needs information on access, uptake and outcomes.
- A claim that a particular initiative caused the decline needs an evaluation that distinguishes its effect from changes already occurring elsewhere.
A broad cohort label such as “Generation Z” does not do that work. Teenagers observed in one year are an age group; a generation is a birth cohort. Both the surrounding period and the people included change across a long comparison. A persuasive explanation must identify what changed, when and through which mechanism.
A local example shows why before-and-after is insufficient
Imagine a program area whose rate falls from 20 to 15 per 1,000 after a new service begins. A comparison area falls from 18 to 14 during the same interval. The first change is −5, the second −4; the difference between changes is −1 per 1,000.
That arithmetic is not proof that the program caused a one-per-1,000 reduction. The areas may differ in prior trends, population composition, other services or measurement. It is a useful prompt to ask what a stronger evaluation would need. Reporting the entire five-point fall as the program’s effect would ignore the wider decline in the example.
Keep service needs and people visible
The report distinguishes first births from second and higher-order births. Those categories can help identify different support needs, but neither category tells the whole story of a person’s circumstances. Educational access, childcare, understandable health information and continuity of care are meaningful outcomes to examine alongside rates.
A responsible summary states the place, period, age range, outcome and denominator, then separates description from explanation. Falling rates can coexist with barriers to care and substantial needs among young parents. Statistical improvement should never become a reason to treat those needs as already resolved.